- How to tell buy rate, ARPPU, and ARPU apart
- What skins, currency, loot, and battle passes actually cost in 2026
- How many of your players will buy in your shop
- First-year planning tables by genre, plus three worked examples
How to read every number in this article
Three metrics get mixed together in industry posts. If you mix them, your forecast is wrong.| Metric | Formula | What it answers |
|---|---|---|
| Buy rate / conversion | Paying players / reachable players | How many people open their wallet |
| ARPPU | Revenue / paying players | How much a buyer spends |
| ARPU | Revenue / all players | How much an average player is worth |
- ARPPU = $50
- ARPU = 0.04 x $50 = $2.00 per player
| Kind of "buy rate" | What it measures | Can you use it as a per-game forecast? |
|---|---|---|
| Lifetime ever-bought | Share of all players who have ever bought this in any game | No. Upper bound only. |
| Per-title conversion of actives | Share of your players who buy your shop in a year | Yes. This is the planning number. |
Takeaway: Do not plan as if 27% of your players will buy a skin. For a new game, expect about 1 to 5% to buy a one-off item, and about 8 to 20% to buy a battle pass.
The 2025 to 2026 market
Platform revenue
| Segment | 2025 figure | Year-over-year | Source |
|---|---|---|---|
| Global games market | $201.6B | +9.1% | Newzoo (opens in a new tab), Global Games Market Report, 2025 full year (2026 update) |
| Mobile | $113.3B | +10.7% | Newzoo (opens in a new tab) |
| Console | $44.7B | +2.8% | Newzoo (opens in a new tab) |
| PC | $43.6B | +12.0% | Newzoo (opens in a new tab) |
| Console in-game spending | $13.3B | -4.6% | Newzoo (opens in a new tab) |
| Console DLC | $2.1B | -23.4% | Newzoo (opens in a new tab) |
| Mobile game IAP (store-tracked) | $81.75B | +1.3% | Sensor Tower, State of Mobile 2026 (opens in a new tab) |
| Mobile game downloads | 50.41B | -7.2% | Sensor Tower (opens in a new tab) |
| Hours played in mobile games | 444.63B | +0.9% | Sensor Tower (opens in a new tab) |
| Share of mobile IAP from top 1% of publishers | 92.5% | n/a | Sensor Tower (opens in a new tab) |
Takeaway: These billions are industry totals, not your forecast. Use them for context, then plan from the players who will actually find and try your game.
Who is buying
| Fact | Figure | Source |
|---|---|---|
| US players 8+ who have ever bought in-game content | 58% | ESA 2026 Essential Facts (opens in a new tab), YouGov, n=13,545, 11 to 25 Feb 2026 |
| Gen Z / Millennial / Gen Alpha buyers, median monthly in-game spend | $20 | ESA 2026 (opens in a new tab) |
| Parents who buy in-game content for their children | 54% | ESA 2026 (opens in a new tab) |
| Of those parents, who require approval | 93% | ESA 2026 (opens in a new tab) |
| PC microtransaction buyers who spend on cosmetics | 52% | WorldMetrics 2026 (opens in a new tab) (secondary recap) |
| Mobile players who have made at least one microtransaction | 68% | WorldMetrics 2026 (opens in a new tab) (secondary recap) |
Takeaway: A teen-only audience will sit below these medians. If parents must approve a purchase, expect fewer impulse buys and a lower ARPU.
What players actually buy
ESA asked US players which types of in-game content they had ever purchased. Multiple answers were allowed, so rows overlap.| Type of in-game content | Share of US players aged 8+ | Source |
|---|---|---|
| In-game currency | 34% | ESA 2026 Essential Facts (opens in a new tab) |
| Skins or customization items | 27% | ESA 2026 (opens in a new tab) |
| Expansion packs | 26% | ESA 2026 (opens in a new tab) |
| Season pass / battle pass | 26% | ESA 2026 (opens in a new tab) |
| Additional maps or levels | 19% | ESA 2026 (opens in a new tab) |
| Randomized content packs | 15% | ESA 2026 (opens in a new tab) |
Takeaway: Do not add currency buyers and pass buyers together. They are often the same purchase. Sell skins and a pass first. Treat loot as optional. Expansions still work if the price matches the game.
What things actually cost
Cosmetics, currency, and loot
| Item | Typical price | Notes | Source |
|---|---|---|---|
| Global average cosmetic purchase | $8.17 in 2025 | Up from $4.52 in 2020 | MarketIntelo, In-Game Apparel Market (opens in a new tab) |
| Basic cosmetic | $0.99 | Entry SKU | MarketIntelo 2025 (opens in a new tab) |
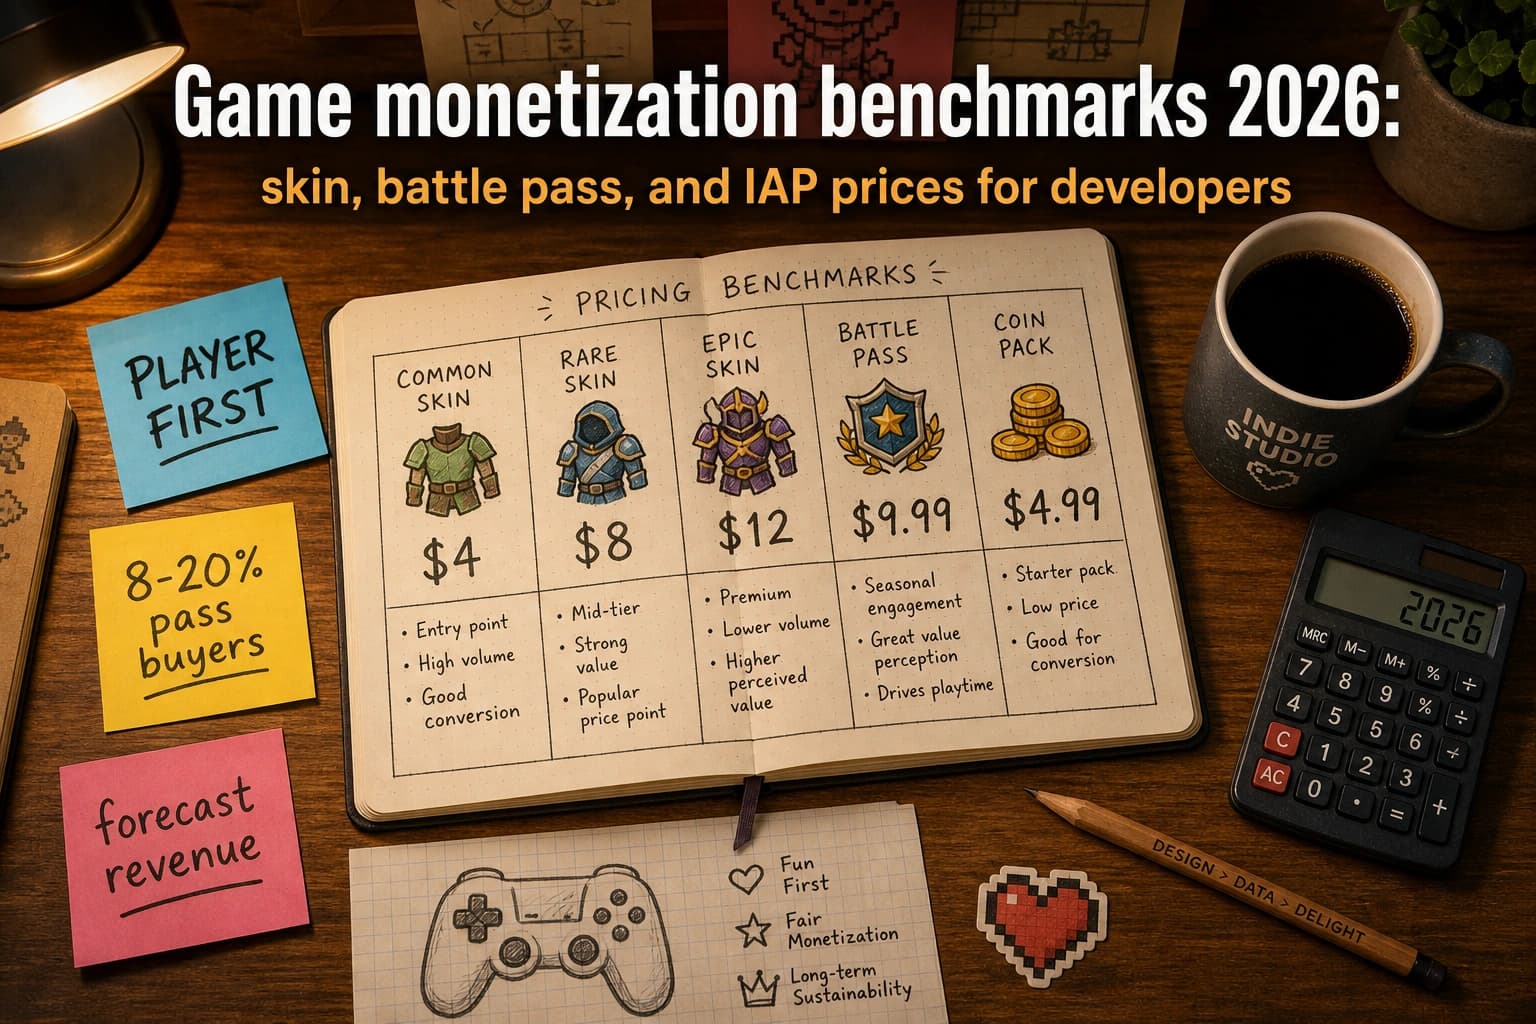
| Common psychological price points | $4.99, $9.99, $19.99 | Convert better than round numbers | MarketIntelo 2025 (opens in a new tab) |
| Premium / legendary cosmetic | $30 to $50+ | Brand collabs and ultra tiers | MarketIntelo 2025 (opens in a new tab) |
| Premium character skin (industry average) | about $15 | Directional | WorldMetrics 2026 (opens in a new tab) (secondary recap) |
| Limited-time cosmetic premium vs permanent | +20 to 50% | Scarcity pricing | MarketIntelo 2025 (opens in a new tab) |
| Regional discount vs US list | 40 to 60% in developing markets | Purchasing-power pricing | MarketIntelo 2025 (opens in a new tab) |
| Currency packs | $4.99 / $9.99 / $19.99 / $49.99 / $99.99 | Larger packs have a better rate | Publisher store listings, 2025 to 2026 |
| Loot / chest ticket | $5 to $10 typical | Lowest ESA ever-bought share | ESA 2026 (opens in a new tab) plus common store SKUs |
| Game content / expansion | $10 to $20 indie; $20 to $40 AAA DLC | Fewer purchases per year | Circana / ESA content mix (opens in a new tab), 2025 to 2026 |
Live-service cosmetic SKUs players already know
| Game | SKU | Price | Source |
|---|---|---|---|
| Valorant | Select Edition weapon skin | 875 VP, about $10 | Riot support / community conversion, 2026 |
| Valorant | Deluxe Edition | 1,275 VP, about $16 | Riot, 2026 |
| Valorant | Premium Edition | 1,775 VP, about $23 | Riot, 2026 |
| Valorant | Exclusive / Ultra | about $26 to $30+ per gun | Dexerto bundle guide; Riot "varies" |
| League of Legends | Standard / Epic skin | 975 to 1,350 RP, about $11 | Riot Points chart, 2026 |
| League of Legends | Legendary | 1,820 RP, about $22 | Riot, 2026 |
| League of Legends | Ultimate | 3,250 RP, about $35 | Riot, 2026 |
| Fortnite | Individual skins | typically $8 to $20 | Epic item shop, 2025 to 2026 |
Takeaway: Price your first cosmetic between $5 and $12, and make it obvious in one screenshot. Valorant and League prices are AAA reference points, not indie targets.
Battle pass prices in 2026
The market converged on ten dollars. MWM's May 2026 catalog (opens in a new tab) of US battle and season-pass products makes that obvious.| Benchmark | Figure | Source |
|---|---|---|
| Apps running a battle / season pass | 754 (73% are games) | MWM, State of May 2026 (opens in a new tab) |
| Game pass items in catalog | 977 | MWM (opens in a new tab) |
| Median game battle pass | $9.99 | MWM (opens in a new tab) |
| 25th percentile (entry) | $5.99 | MWM (opens in a new tab) |
| Premium tail (top 10%) | $29.99 | MWM (opens in a new tab) |
| Typical standard pass | $5 to $10 / season | MWM (opens in a new tab) |
| Premium / deluxe pass | $15 to $25 | MWM (opens in a new tab) |
| Tier-skip bundle | $5 to $15 | MWM (opens in a new tab) |
| Annual / subscription pass | $30 to $60 / year | MWM (opens in a new tab), emerging |
| Typical season length | 4 to 12 weeks | MWM (opens in a new tab) |
| Pass adoption in top live-service titles | about 85% | Cubix (opens in a new tab) / Kevuru 2026 recaps |
| Pass adoption in top online multiplayer (2025) | about 73% | Dataintelo (opens in a new tab) |
| Pass share of those titles' revenue | 22 to 35% | Dataintelo (opens in a new tab) |
| Enrolled consumer spend per season (pass + extras) | about $31.50 | Dataintelo (opens in a new tab) |
2026 live-service list prices
These are premium-currency prices, not always a clean dollar tag.| Game | Premium pass | Season checked | Source |
|---|---|---|---|
| Fortnite | 800 V-Bucks ($8.99 cheapest pack after 19 Mar 2026) | From 19 Mar 2026 | Epic Games (opens in a new tab) |
| Apex Legends | 950 Apex Coins | Season 30, from 4 Aug 2026 | EA / Respawn |
| Marvel Rivals | 990 Lattice | Season 9, Jul 2026 | NetEase |
| Valorant | 1,000 VP (about $9.99) | 2026 Act 2, from 18 Mar 2026 | Riot |
| Overwatch | 1,000 Overwatch Coins (about $10) | Season window Apr to Jun 2026 | Blizzard |
| Call of Duty: Black Ops 7 | 1,100 COD Points | Season 05, from 23 Jul 2026 | Activision |
Takeaway: Price a full live-service pass at $9.99. Start at $5.99 if the game is casual or small. If the pass pays for the next pass, count that as retention, not extra revenue.
How many players pay
Industry bands
| Shop | Per-title conversion of actives | Lifetime ever-bought (US, any game) | Source |
|---|---|---|---|
| One-off IAP (a single skin, pack, or currency bundle) | 1 to 5% | Skins 27%, currency 34%, loot 15% | MWM 2026 (opens in a new tab); ESA 2026 (opens in a new tab) |
| First purchase after install (mobile) | 2 to 5% typical; 8 to 12% top mid-core | n/a | AppFollow 2026 (opens in a new tab), compiling AppsFlyer / Sensor Tower / Newzoo |
| Battle pass | 8 to 20% of actives | 26% | MWM 2026 (opens in a new tab); ESA 2026 (opens in a new tab) |
| Well-timed battle pass in a top title | 15 to 20% | n/a | Cubix (opens in a new tab) / Kevuru 2026 (secondary recaps) |
| Mobile multi-pass | 8 to 12% | n/a | Recited (opens in a new tab) (secondary) |
| Console single-pass | 25 to 35% | n/a | Recited (opens in a new tab) (secondary) |
Mobile IAP conversion by genre (US / Canada, 2026)
| Genre band | IAP conversion | Source |
|---|---|---|
| Hyper-casual | 0.5 to 2% | RewardingHub 2026 (opens in a new tab) |
| Casual | 2 to 4% | RewardingHub 2026 (opens in a new tab) |
| Mid-core | 3 to 6% | RewardingHub 2026 (opens in a new tab) |
| RPG | 4 to 8% | RewardingHub 2026 (opens in a new tab) |
| Casino (first purchase in 30 days) | 4.95% | AppsFlyer, App Monetization 2026 (opens in a new tab) |
Takeaway: More players will buy a pass than a single skin. If you sell both, cut your shop forecast by about 15%, because the pass often includes the skins people wanted.
Revenue per person
These numbers are not all measuring the same window. Read the period column.| Metric | Period | Figure | Source |
|---|---|---|---|
| Casual IAP ARPPU | Day 90 | $7.26 | AppsFlyer 2026 (opens in a new tab) |
| Mid-core IAP ARPPU | Day 90 | $9.80 | AppsFlyer 2026 (opens in a new tab) |
| Casino IAP ARPPU | Day 90 | $11.40 | AppsFlyer 2026 (opens in a new tab) |
| Casual IAP ARPU | Day 90 | $1.34 | AppsFlyer 2026 (opens in a new tab) |
| Mid-core IAP ARPU | Day 90 | $2.13 | AppsFlyer 2026 (opens in a new tab) |
| Casino IAP ARPU | Day 90 | $2.43 | AppsFlyer 2026 (opens in a new tab) |
| Casual monthly ARPPU | Month | $10 to $30 | AppFollow 2026 (opens in a new tab) compile |
| Mid-core monthly ARPPU | Month | $50 to $100 | AppFollow 2026 (opens in a new tab) compile |
| Gacha / hardcore monthly ARPPU | Month | often $100+ | AppFollow 2026 (opens in a new tab) |
| Mobile ARPPU | Month | about $12.30 | WorldMetrics 2026 (opens in a new tab) (directional, secondary) |
| Free-to-play ARPU | Month | $7.20 | WorldMetrics 2026 (opens in a new tab) (secondary) |
| US mobile player microtransaction spend | Month | $15.60 | WorldMetrics 2026 (opens in a new tab) (secondary) |
| ESA buyer median in-game spend | Month | $20 | ESA 2026 (opens in a new tab), younger generations |
| Top RPG / strategy paying user | Unspecified, tier-1 markets | $45+ | Cubix 2026 (opens in a new tab) (secondary) |
| Mobile shooter annual ARPPU | Year | $45 to $120 | Dataintelo (opens in a new tab), Mobile Shooter, 2025 |
| Broader mobile annual ARPPU band | Year | $30 to $65 | Dataintelo 2025 (opens in a new tab) |
| Console single-pass ARPPU | Season | $12 to $18 | Recited (opens in a new tab) (secondary) |
| Mobile multi-pass ARPPU | Season | about $47 | Recited (opens in a new tab) (secondary) |
| Pass + supplemental cosmetics | Season | about $31.50 | Dataintelo 2025 (opens in a new tab) |
Takeaway: Do not mix Day-90 numbers with monthly or yearly numbers. For an indie PC shop, plan about $20 to $60 per year from each buyer, not $50 to $100 a month.
What each genre actually sells
Industry recaps in 2026 agree on the shape, even when they disagree on the exact dollar.| Genre | Primary live-ops motion | What to sell first | Source |
|---|---|---|---|
| Shooter / Action | Battle pass + cosmetics | Season pass, then weapon / operator skins | Cubix 2026 (opens in a new tab); MWM 2026 (opens in a new tab) |
| MOBA | Cosmetics and seasonal content | Skins, then a pass | Cubix 2026 (opens in a new tab) |
| RPG | Collection + cosmetics | Characters, skins, currency; pass is secondary | Cubix (opens in a new tab) / Kevuru 2026 |
| Strategy | Premium currency | Time / resource packs, then a mid-core pass | Cubix 2026 (opens in a new tab); Sensor Tower 2026 (opens in a new tab) |
| Sports | Seasonal leagues + packs | Currency, player packs, kits, a season pass | WorldMetrics (opens in a new tab) sports MTX; ESA (opens in a new tab) content mix |
| Casual / puzzle | Ads + cheap IAP | $5 to $6 cosmetics, $5.99 pass, rewarded ads | RewardingHub (opens in a new tab); Cubix (opens in a new tab) |
| Adventure / story | Premium + DLC | Game content first, light cosmetics | Newzoo PC / console 2026 (sandbox vs story split) |
| Hyper-casual | Ads | Do not plan a $10 pass | Cubix 2026 (opens in a new tab) (about 90% ads) |
Takeaway: Match the shop to the genre. Action games sell a pass and skins. Adventure games sell DLC. Hyper-casual games should not plan a $10 pass.
Planning tables by genre
The tables below are first-year, per-title planning defaults for a reachable PC audience. They sit inside the research bands above. They are not Fortnite, Genshin, or Call of Duty Mobile. How to use a row:- Take your reachable players (the people who will actually find and try the game).
- Multiply by buy rate. That is your buyers.
- Multiply buyers by price x purchases per year. That is first-year revenue for that shop.
ARPU = buy rate x price x purchases per year
Purchases per year is how often a buyer comes back. A $10 pass bought 3.5 times is not $10 of revenue. It is $35 from that buyer.
Battle pass
| Genre | Default price | Buy rate | Paid seasons / year | ARPPU | ARPU |
|---|---|---|---|---|---|
| Action | $9.99 | 16% | 3.5 | $35.0 | $5.59 |
| Adventure | $9.99 | 9% | 2.5 | $25.0 | $2.25 |
| Casual | $5.99 | 10% | 3.5 | $21.0 | $2.10 |
| Racing | $9.99 | 12% | 3.0 | $30.0 | $3.60 |
| Role Playing | $9.99 | 12% | 3.0 | $30.0 | $3.60 |
| Simulation | $7.99 | 10% | 2.8 | $22.4 | $2.24 |
| Sports | $9.99 | 14% | 3.5 | $35.0 | $4.90 |
| Strategy | $9.99 | 11% | 3.0 | $30.0 | $3.30 |
| Other | $9.99 | 12% | 3.0 | $30.0 | $3.60 |
Skins
| Genre | Default SKU | Buy rate | Purchases / year | ARPPU | ARPU |
|---|---|---|---|---|---|
| Action | $12 | 3.2% | 2.5 | $30.0 | $0.96 |
| Adventure | $8 | 1.8% | 2.0 | $16.0 | $0.29 |
| Casual | $6 | 2.0% | 2.2 | $13.2 | $0.26 |
| Racing | $10 | 2.8% | 2.4 | $24.0 | $0.67 |
| Role Playing | $10 | 4.2% | 2.8 | $28.0 | $1.18 |
| Simulation | $8 | 2.5% | 2.3 | $18.4 | $0.46 |
| Sports | $12 | 3.5% | 2.6 | $31.2 | $1.09 |
| Strategy | $8 | 2.2% | 2.2 | $17.6 | $0.39 |
| Other | $8 | 2.5% | 2.4 | $19.2 | $0.48 |
Currency
| Genre | Default pack | Buy rate | Purchases / year | ARPPU | ARPU |
|---|---|---|---|---|---|
| Action | $9.99 | 3.5% | 3.5 | $35.0 | $1.22 |
| Adventure | $9.99 | 2.0% | 2.5 | $25.0 | $0.50 |
| Casual | $4.99 | 2.5% | 3.0 | $15.0 | $0.37 |
| Racing | $9.99 | 2.5% | 3.0 | $30.0 | $0.75 |
| Role Playing | $9.99 | 4.5% | 3.8 | $38.0 | $1.71 |
| Simulation | $7.99 | 2.8% | 3.0 | $24.0 | $0.67 |
| Sports | $9.99 | 4.0% | 3.5 | $35.0 | $1.40 |
| Strategy | $9.99 | 4.0% | 4.0 | $40.0 | $1.60 |
| Other | $9.99 | 3.0% | 3.2 | $32.0 | $0.96 |
Loot packs
| Genre | Default ticket | Buy rate | Purchases / year | ARPPU | ARPU |
|---|---|---|---|---|---|
| Action | $7.99 | 1.5% | 2.5 | $20.0 | $0.30 |
| Adventure | $6.99 | 1.0% | 2.0 | $14.0 | $0.14 |
| Casual | $4.99 | 1.0% | 2.2 | $11.0 | $0.11 |
| Racing | $6.99 | 1.2% | 2.2 | $15.4 | $0.18 |
| Role Playing | $9.99 | 2.5% | 3.0 | $30.0 | $0.75 |
| Simulation | $5.99 | 1.2% | 2.0 | $12.0 | $0.14 |
| Sports | $7.99 | 2.0% | 2.8 | $22.4 | $0.45 |
| Strategy | $6.99 | 1.5% | 2.4 | $16.8 | $0.25 |
| Other | $6.99 | 1.2% | 2.2 | $15.4 | $0.18 |
Game content (DLC, expansions, maps, story packs)
| Genre | Default price | Buy rate | Purchases / year | ARPPU | ARPU |
|---|---|---|---|---|---|
| Action | $14.99 | 2.0% | 1.2 | $18.0 | $0.36 |
| Adventure | $19.99 | 3.0% | 1.3 | $26.0 | $0.78 |
| Casual | $9.99 | 1.0% | 1.1 | $11.0 | $0.11 |
| Racing | $12.99 | 1.8% | 1.2 | $15.6 | $0.28 |
| Role Playing | $19.99 | 3.5% | 1.4 | $28.0 | $0.98 |
| Simulation | $14.99 | 2.2% | 1.2 | $18.0 | $0.40 |
| Sports | $14.99 | 2.5% | 1.3 | $19.5 | $0.49 |
| Strategy | $14.99 | 2.0% | 1.2 | $18.0 | $0.36 |
| Other | $14.99 | 2.0% | 1.2 | $18.0 | $0.36 |
Takeaway: Find your genre row. First-year revenue is reachable players times buy rate times (price times purchases per year). That is your shop, not Fortnite.
Three worked examples
Example A. Free-to-play multiplayer action game
Assume 50,000 reachable players in year one. You ship a $9.99 pass, $12 skins, and $9.99 currency. No loot.| Shop | Buyers | Spend per buyer | Revenue | ARPU |
|---|---|---|---|---|
| Battle pass | 8,000 (16%) | $35.0 | $279,720 | $5.59 |
| Skins | 1,600 (3.2%) | $30.0 | $48,000 | $0.96 |
| Currency | 1,750 (3.5%) | $35.0 | $61,163 | $1.22 |
| Shop after 15% pass overlap | n/a | n/a | $92,788 | $1.86 |
| Total live-ops | n/a | n/a | $372,508 | $7.45 |
Example B. Premium $25 adventure game plus DLC
The box price does the heavy lifting. Add a $19.99 expansion and a light $8 skin line. On 20,000 reachable players:| Line | Buy rate | Revenue |
|---|---|---|
| Game ($25, using your store conversion, not these live-ops rates) | your catalog model | catalog revenue |
| Game content | 3.0% x $19.99 x 1.3 | about $15,600 |
| Skins | 1.8% x $8 x 2.0 | about $5,760 |
Example C. Casual game, $5.99 pass only
On 100,000 reachable players:- Buyers: 10,000
- Spend: $5.99 x 3.5 = $20.97
- Revenue: about $209,700
- ARPU: $2.10
Takeaway: In a free-to-play action game, the pass is most of the live-ops money. In a $25 adventure game, live-ops is a bonus. The box price is still the business.
Design notes that change the math
Price the pass at a visible discount. MarketIntelo (opens in a new tab) says a $9.99 to $19.99 pass often looks like 30 to 40% off the a la carte value of the items inside. If the pass is not obviously cheaper than buying two skins, people will not convert at 8 to 20%. Keep a free track. The free track fills lobbies and teaches the loop. The paid track is the product. Keep seasons between 4 and 12 weeks. Shorter than four weeks feels like a chore. Longer than twelve loses the deadline. Most action games land near five seasons a year. Casual can run more, cheaper. Do not put progression power in the shop if you sell a competitive game. Cosmetics are the majority of in-game spend because they do not break the match. Pay-to-win still prints money in 4X and some RPGs. It also prints reviews you cannot undo. Loot is optional and politically expensive. ESA puts randomized packs last. If you ship them, disclose odds, cap child spend, and do not make the only good skin a chest exclusive. A pass can eat your shop. Watch ARPPU after the first season. If high spenders drop, the pass is too generous. Deconstructor of Fun (opens in a new tab) called this out in 2022. It is still true. Currency is not content. A coin pack with nothing worth buying is a dead SKU. Currency ARPU only shows up if skins, passes, or content exist to sink it.Takeaway: Make the pass look cheaper than two skins, keep a free track, and keep seasons between 4 and 12 weeks. Do not put power in a competitive shop.
Your takeaway
If you are shipping a live game in 2026, start with three prices:- A $6 to $12 cosmetic people can understand in one screenshot.
- A $5.99 or $9.99 pass with a free track and a season short enough to finish.
- A currency pack only if something on that list is worth buying.
- Split the metrics. Buy rate is how many players pay. ARPPU is how much a buyer spends. ARPU is those two multiplied. Never apply ARPPU to every player.
- Use 1 to 5% for a single item and 8 to 20% for a pass. Adjust down if the game is new or single-player.
- Price a cosmetic at $5 to $12. Price a pass at $5.99 (casual or small) or $9.99 (live action). Add coins only if there is something worth buying.
- If you run a pass and a shop, cut shop revenue by about 15%. The pass often includes the skins people wanted.
- Sell what the genre already buys. Action: pass and skins. Adventure: DLC. Casual: a cheap pass. Hyper-casual: ads, not a $10 pass.
Sources
- Entertainment Software Association, 2026 Essential Facts About the U.S. Video Game Industry (opens in a new tab). YouGov survey of 13,545 US respondents, 11 to 25 February 2026.
- ESA press release, 3 June 2026 (opens in a new tab).
- Game Developer / Circana coverage of ESA 2026 spend (opens in a new tab).
- Newzoo, Year in review: 2025 (opens in a new tab). Global Games Market Report quarterly update, June 2026, covering full-year 2025.
- Sensor Tower, State of Mobile 2026 (opens in a new tab) and State of Gaming 2026 (opens in a new tab). Mobile game IAP $81.75B; strategy / puzzle growth.
- MWM, Battle Pass: How It Works, 2026 Pricing Benchmarks and Design (opens in a new tab). State of May 2026 catalog.
- MarketIntelo, In-Game Apparel Market Research Report 2034 (opens in a new tab). 2025 pricing section: $8.17 average cosmetic.
- MIDiA Research, The "why" and "what" behind in-game spending (opens in a new tab). August 2024. Q1 2024 survey in US, UK, Australia, Canada, Germany, France, Poland, Turkey, South Africa.
- AppsFlyer, The State of App Monetization, 2026 Edition (opens in a new tab). D90 IAP ARPU / ARPPU and conversion.
- AppFollow, Mobile Game KPIs: The 2026 Guide to Gaming Metrics (opens in a new tab).
- RewardingHub, Mobile Game Monetization Benchmarks by Genre 2026 (opens in a new tab).
- Dataintelo, Online Microtransaction Market (opens in a new tab). Pass adoption, $31.50 per season, shooter ARPPU $45 to $120.
- Recited, Battle Passes and Season Passes (opens in a new tab). Mobile vs console conversion and ARPPU. Secondary playbook.
- Deconstructor of Fun, Battle Passes: Everything You Ought to Know and Then Some (opens in a new tab). 4 June 2022.
- WorldMetrics, Microtransactions In Video Games Statistics, 2026 Edition (opens in a new tab). 12 Feb 2026, verified 11 Jul 2026. Secondary recap.
- Epic Games, Fortnite V-Bucks Price Increase (opens in a new tab). 10 March 2026, effective 19 March 2026.
- Riot Games. Valorant skin tiers and Riot Points / VP pack prices, 2026. Publisher listings, no single stable public support URL.
- Cubix, Game Monetization Statistics 2026 (opens in a new tab). 8 July 2026. Secondary recap, not a primary survey.
- Kevuru Games, Game Monetization Statistics: Data and Insights. Secondary recap of the 15 to 20% pass band.
- Xiao, Zhang, Mao. What Makes Loyalty Programme Work: The Effectiveness of the Battle Pass System in Chinese MOBA Game. Advances in Economics, Management and Political Sciences 172 (published 8 May 2025). Academic pass and loyalty framing, not Western ARPU.