What is ARPU and why should you care?
ARPU stands for Average Revenue Per User. It tells you how much money, on average, each player contributes over a certain period, usually a year. Important: ARPU includes all users, paying or not. It’s different from ARPPU (Average Revenue Per Paying User), which only looks at those who actually spend. Think of ARPU as the "big picture," and ARPPU as zooming in on the whales, the players who keep your servers humming and your CFO happy.How big is the global gaming wallet?
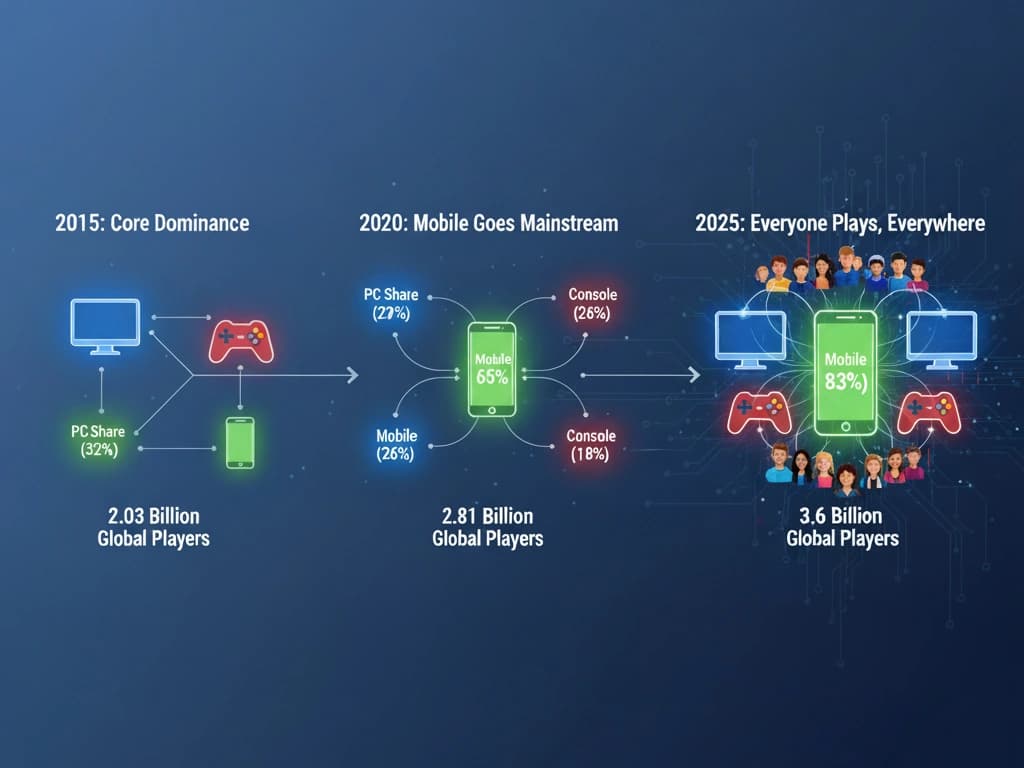
By 2025, we’re looking at nearly $189 billion in revenue from 3.6 billion gamers worldwide. That’s a lot of zeros, but what really matters is how that cash spreads across platforms, age groups, and gender. After the pandemic spike in 2020 ($159.3B), growth is stabilizing, and we’re moving from “get more players” to “get more from the players you already have.” Table 1: Global Player Base and Annual Revenue (2015–2030)| Metric | 2015 | 2020 | 2025 | 2030 Forecast |
|---|---|---|---|---|
| Global Player Base (Billions) | 2.0 | 2.69 | 3.6 | 3.8 |
| Total Global Revenue (Billion USD) | 86.4 | 159.3 | 188.8 | 500–666 |
| Derived Global ARPU (USD) | 43.1 | 59.2 | 61.2 | 132–175 |
Platform spending: mobile rules, console pays
Mobile gaming is everywhere, literally in everyone’s pocket. By 2025, it’s expected to rake in $103B from 2.8B players. Here is also where the revenue for you is, with the highest ARPU of ~$28. Consoles are where the ARPPU magic happens (do not miss the second P in ARPPU here, Average Revenue Per Paying User). Projected revenue hits $45.9B from 800M players. Add in new hardware cycles (hello, Switch 2) and subscriptions, and core console households can spend $400–500 a year. PC is steady at $39.9B, with 1.3B players. The ARPU is lower (~$11), but those dedicated PC gamers spend on expensive hardware and live-service titles, which adds hidden value. Table 2: Platform Revenue (2015, 2020, 2025, 2030)| Platform | 2015 Revenue (B USD) | 2020 Revenue (B USD) | 2025 Revenue (B USD) | 2030 Forecast (B USD) |
|---|---|---|---|---|
| Mobile | 30.3 | 77.2 | 103.0 | 256–339 |
| Console | 29.0 | 45.2 | 45.9 | 60-80 |
| PC | 27.1 | 36.9 | 39.9 | 30-50 |
| Cloud Gaming | N/A | N/A | 5–10 | 28–40 |
| Subscription Services | N/A | N/A | 11.5 | 20–46 |
| Web3 / Blockchain Gaming | N/A | N/A | 13 | 28–301 |
| Total | 86.4 | 159.3 | 188.8 | 500–666 |
| Platform | 2015 ARPU (USD) | 2020 ARPU (USD) | 2025 ARPU (USD) | 2030 Forecast ARPU (USD) |
|---|---|---|---|---|
| Mobile | 15.1 | 28.7 | 28.6 | 67–89 |
| Console | 14.5 | 16.8 | 12.75 | 15–21 |
| PC | 13.5 | 13.7 | 11.1 | 7–13 |
| Cloud Gaming | N/A | N/A | 2.0 | 7–10 |
| Subscription Services | N/A | N/A | 3.2 | 5–12 |
| Web3 / Blockchain Gaming | N/A | N/A | 3.6 | 7–79 |
| Total (Global ARPU) | 43.1 | 59.2 | 61,2 | 132–175 |
Age matters: who’s spending what
Young adults, ages 18–34, are the real spenders. Gen Z (18–24) drops ~$21.50 per month on in-game purchases, and 72% actually make purchases. Millennials (25–34) aren’t far behind at $19.30. Meanwhile, Gen X and older adults spend less per person, but families and older gamers are growing segments with serious total spend. Table 3: Monthly In-Game Purchase Spending by Age and Gender| Demographic | Avg Monthly Spend (USD) | Purchase Rate | Notes |
|---|---|---|---|
| Gen Z (18–24) | 21.50 | 72% | Highest engagement |
| Millennials (25–34) | 19.30 | 68% | Core retention target |
| Gen X (35–44) | 14.60 | 55% | Household spend matters |
| 55+ | 7.90 | 31% | Fastest growth during 2020–21 |
What does it all mean for developers?
- Focus on ARPPU, not just total player count. Big markets are full of small spenders; your dollars come from whales.
- Target 18–34 for live-service titles, they spend most frequently.
- Don’t ignore women in mobile, optimized monetization here pays off.
- Console growth is back in play; PC is steady.
- Report: Free-to-Play market worth $7bn by 2015
- Mobile games revenue to overtake consoles in 2015, says analyst
- Midia Research: Video games to pass $300bn revenue, 3.8 billion players by 2030
- Newzoo Global Games Market Report 2025
- Global games market to hit $189 billion in 2025 as growth shifts to console - Newzoo
- In-Game Purchase Spending Habit Statistics (2025) - Co-op Board Games
- 39 Statistics That Show Women Gamers Are Redefining the Industry - Plarium