The Steam Rollercoaster: Launch Week vs. Lifetime
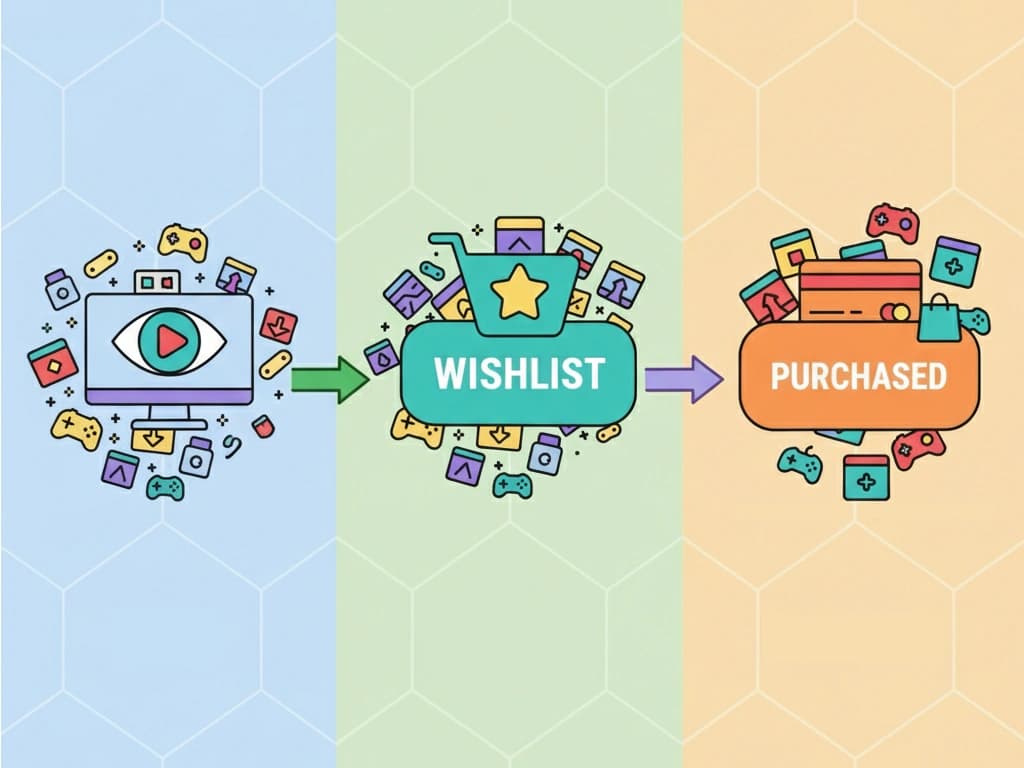
On PC, particularly on Steam, the typical player journey follows the path Views → Wishlists → Purchases. It appears linear, but in reality, each step loses a significant portion of potential buyers , and the dynamics shift between launch week and a game’s lifetime. Launch Week| Funnel Stage | Range | Typical % | What It Means (Short) |
|---|---|---|---|
| View → Wishlist (V2W) | Low | 2.5–3.5% | New page, low engagement |
| Average | 10–18% | Typical for most mid-level titles | |
| High | 18–22% | Strong genre or community interest | |
| Viral | Up to 50% | Driven by influencers or targeted campaigns | |
| Wishlist → Purchase (W2P) | Low | <1.9% | Inflated wishlists, weak conversion |
| Average | 8–12% | Common during early launch | |
| High | 15–25% | High engagement and effective marketing | |
| View → Sale (V2S) | Low | 0.25–0.5% | Typical early-stage traction |
| High | 2–2.5% | Exceptional launch performance |
| Funnel Stage | Range | Typical % | What It Means (Short) |
|---|---|---|---|
| View → Wishlist (V2W) | Low | 2–5% | Casual browsing behavior |
| Average | 10–18% | Steady interest over time | |
| High | 18–22% | Dedicated fanbase | |
| Viral | Up to 50% | Event- or campaign-driven spikes | |
| Wishlist → Purchase (W2P) | Low | <1.9% | Minimal conversion from interest |
| Average | 10–12% | Typical long-term conversion rate | |
| High | 20–25%+ | Deep community engagement | |
| View → Sale (V2S) | Low | 0.25–0.5% | Common for most PC games |
| High | 2–2.5% | Long-term top-tier results |
Mobile: The Opposite Problem
On mobile platforms, wishlists don’t exist , downloads are the key metric. But while installs are easy to achieve, monetization is notoriously difficult.| Platform | Conversion (Views → Install) | Install → First Purchase | Takeaway |
|---|---|---|---|
| iOS App Store | 25–33% | 1–2% | High install rates, low monetization |
| Google Play | 26–27% | 1–2% | Similar trend, slightly higher reach |
Console Stores: Smaller Audience, Higher Intent
On PlayStation, Xbox, and Nintendo eShop, the audience behaves differently. Console users typically open the store intending to make a purchase.| Store Type | View → Purchase Rate | Why It’s Higher |
|---|---|---|
| PlayStation / Xbox eShop | 3–3.5% | Focused audience, higher intent |
| PC (Steam, avg.) | 0.25–2.5% | Broader traffic, lower buyer intent |
What Actually Moves the Needle
Across all platforms, several consistent truths emerge:- Quality of traffic outweighs quantity. Reaching the right audience matters more than broad exposure.
- Targeted marketing converts best. Influencers, demos, and optimized store pages outperform general paid ads.
- Sales timing is critical. Discounts and event-based promotions still drive significant revenue.
- Retention determines success. Whether measured by long-term engagement or replay rate, sustained interest directly supports profitability.
The Real Takeaway
There’s no universal benchmark for success. A 2% View-to-Sale rate on Steam can yield strong returns at a premium price point, while a 1% monetization rate on mobile can generate millions with enough users. The essential skill is identifying where your funnel is leaking , and addressing it systematically. Weak visuals? Update your store page. Flat wishlists? Launch a demo or targeted campaign. Stagnant sales? Experiment with pricing or promotions. Every game’s funnel is different, but the principle is consistent: a smaller, motivated audience that buys is far more valuable than a large one that doesn’t. More to read here:- Steamworks Developer Documentation, 2024
- Sensor Tower: Mobile App Conversion Benchmarks, 2024
- GameAnalytics: Mobile Retention Metrics Report, 2024
- Statista: Global E-commerce Conversion Rates, 2024
- r/gamedev Reddit: Wishlist Conversion Analysis
- Practical Media: Steam Wishlist Ratios
- Udonis Blog: In-App Purchases Guide
- Apple Ads: App Store Ads Conversion